
Analytics have become central to many organization's business strategy. For those involved in the API ecosystem, analytics unlock a deeper level of visibility into APIs performance and how developers use them. Key metrics and reportings can fuel the improvisation of API products and services to better serve their businesses and their respective user bases.
XapiX’s recently launched analytics tools make it easy to share and gain valuable API consumer and infrastructure insights. With useful key metrics, such as response time, API usage request, and throughput by endpoint, users are able to quickly find trends and solutions to resolve issues and to quickly improve your business.In Insights, you now have the capability to view API consumer and infrastructure analytics.
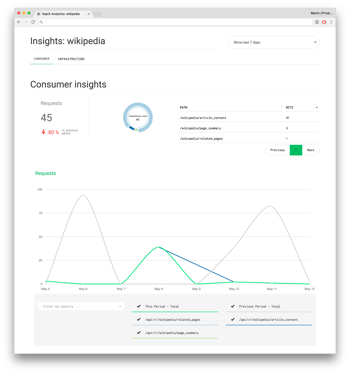
.png?width=350&name=Screen%20Shot%202017-05-11%20at%2017.47.26%20(1).png)
API consumers analytics provide valuable insights that are needed to track business metrics, API traffic, and the quality of their API services. Using the XapiX analytical tools, users can gain and share insights on data related to their APIs using the following metrics:
- • Number of requests made to your API with details on the number of hits by each endpoint used in your integration.


• A detailed log of the requests to show more individual interactions made by users using your API.

API infrastructure analytics provide with operational metrics to leverage data to further improve API performance and to quickly identify and track errors. XapiX provides real-time infrastructure analytics using the following metrics:
• Response time, client errors and server errors with options to compare percentage changes in relation to a period.

• Data trends on response time by endpoints and throughput by endpoints over time with options to filter by country.


• More detailed analytics on infrastructure errors to provide details around error, which is especially useful for debugging.

With these new set of tools, XapiX makes it easy to share clear visuals and data sets. Whether for reporting or data analysis, we hope it will help our users make the most of their API projects that they develop on our platform.